Waitlist
 For those of you who have been waitlisted at one of your top choices, here's our initial update of Class of 2028 waitlist notification dates and status where available.
 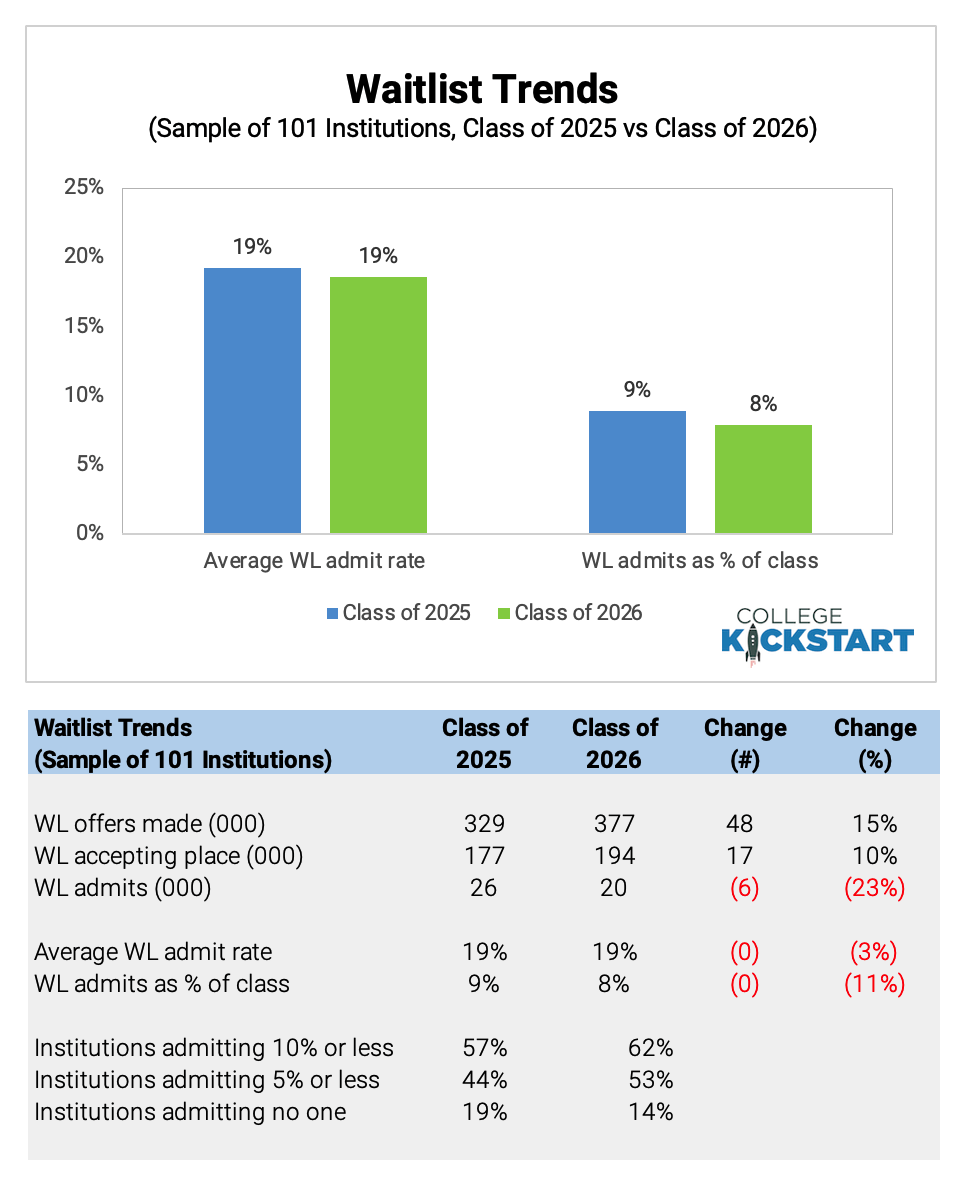 For those of you who have been waitlisted at one of your top choices, here's our initial update of Class of 2027 waitlist notification dates and status where available.
 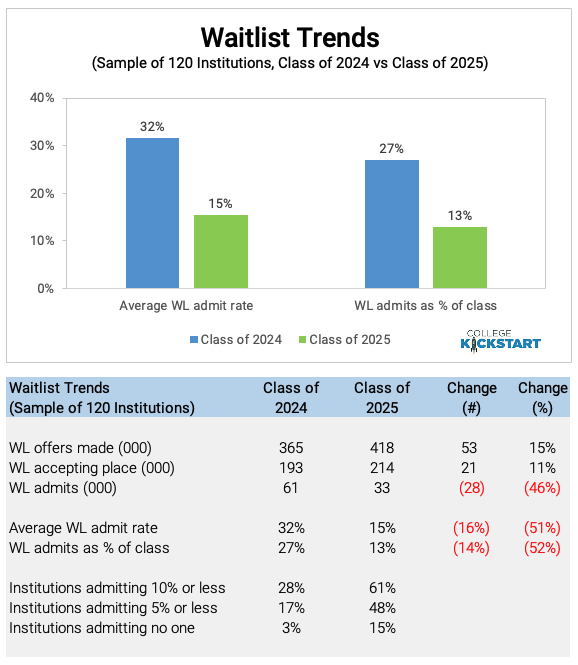 For those of you who have been waitlisted at one of your top choices, here's our initial update of Class of 2026 waitlist notification dates and status where available.
 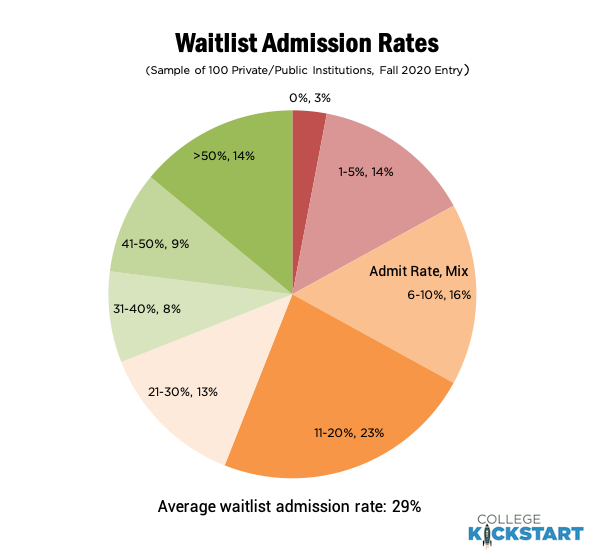 For those of you who have been waitlisted at one of your top choices, here's a list of 2020 waitlist statistics for several popular private and public schools, along with notification dates and latest status where available.
 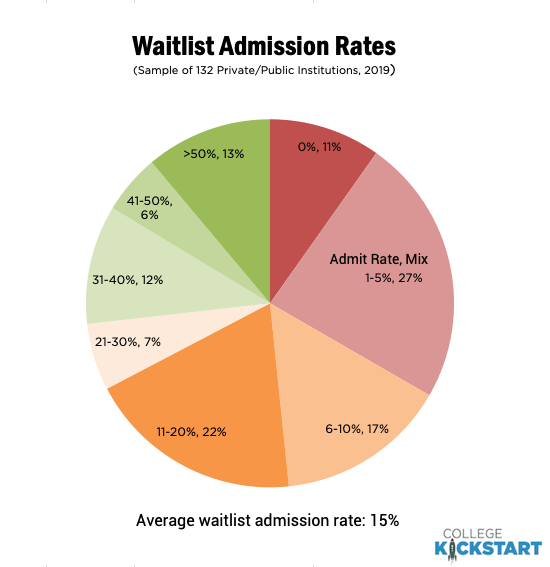 For those of you who have been waitlisted at one of your top choices, here's a list of 2019 waitlist statistics for several popular private and public schools, along with notification dates and latest status where available.
 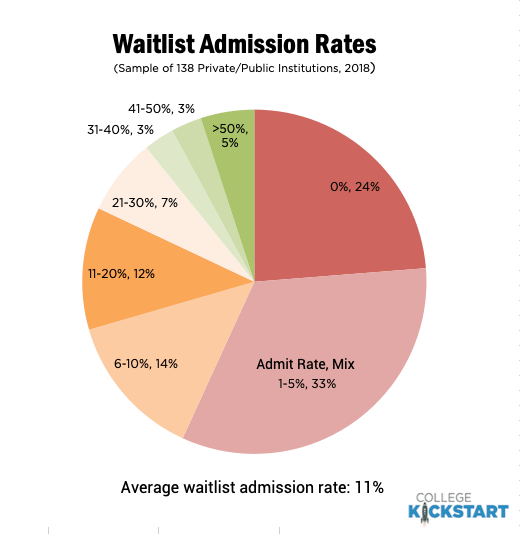 For those of you that have been waitlisted at one of your top choices, here's a list of 2018 waitlist statistics for several popular private and public schools, along with notification dates and latest status where available.
 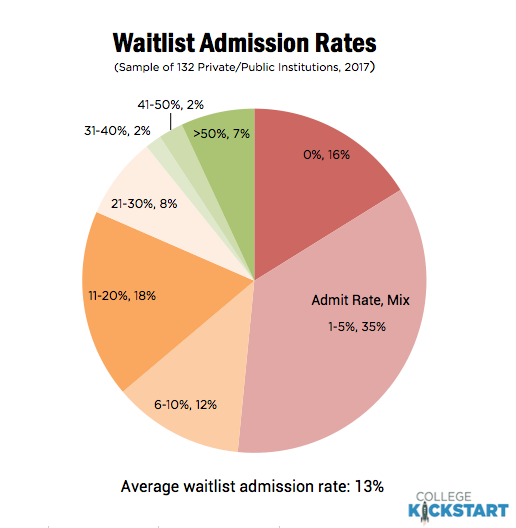 For those of you that have been waitlisted at one of your top choices, here's a list of 2017 waitlist statistics for several popular private and public schools, along with notification dates and latest status where available.
 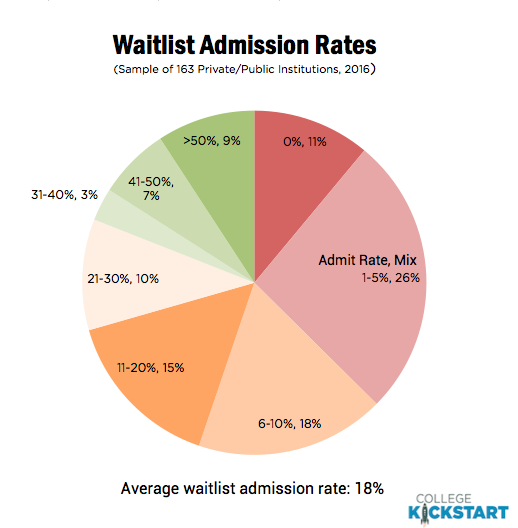 For those of you that have been waitlisted at one of your top choices, here's a list of 2016 waitlist statistics for several popular private and public schools, along with notification dates and latest status where available.
 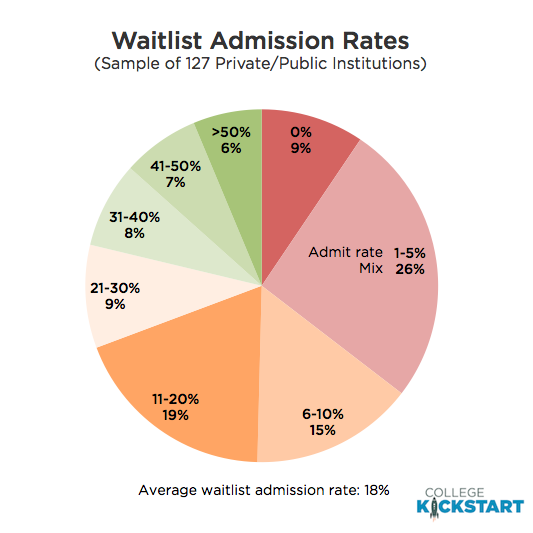 For those of you that have been waitlisted at one of your top choices, here's a list of waitlist statistics for several popular private and public schools, along with notification dates and links for more detail if available.
 Get our latest data and insights
Give your college plan a boost
Balance list, maximize odds and minimize wasted motion. Current data and personalized recommendations.
Students, learn more Counselors, learn more
Archives
- Your College List (105)
- Early Admission (251)
- Standardized Testing (15)
- Class of 2029 (49)
- Class of 2028 (54)
- Class of 2027 (64)
- Class of 2026 (62)
- Class of 2025 (78)
- Class of 2024 (69)
- Class of 2023 (87)
- Class of 2022 (82)
- Class of 2021 (80)
- Class of 2020 (65)
- Class of 2019 (6)
- Waitlist (10)
- Financial Aid (4)
- College Tour Planner (0)
- Whirlwind Tours (0)
- Essays (9)
- College Kickstart (58)
- Product Announcements (12)
- Perspectives (102)
- College Rankings (28)
- Affordability (12)
- AP Exams (3)
- Miscellaneous (11)
Hot Topics
- UC Santa Barbara
- Claremont McKenna
- Williams
- Dartmouth
- Ivy League
- Stanford
- UC Davis
- Class of 2023
- MIT
- Emory
- Brown
- Cornell
- Rice
- UCLA
- Colby
- Boston College
- Yale
- Early Decision
- Harvard
- UC Berkeley
- Princeton
- Northwestern
- Georgia Tech
- Wesleyan
- University of Virginia
- Columbia
- Johns Hopkins
- University of Pennsylvania
- Georgetown
- Boston University
- Class of 2022
- Duke
- Middlebury
- UC Irvine
- Class of 2021
- Notre Dame
- Swarthmore
- Vanderbilt
- Pomona
- Early Action